Is Accenture a good buy ?
Multi-agent AI debate verdict and arguments
⚠️ Not an investment advice
Completed May 4, 2026
Tournament Final Verdict
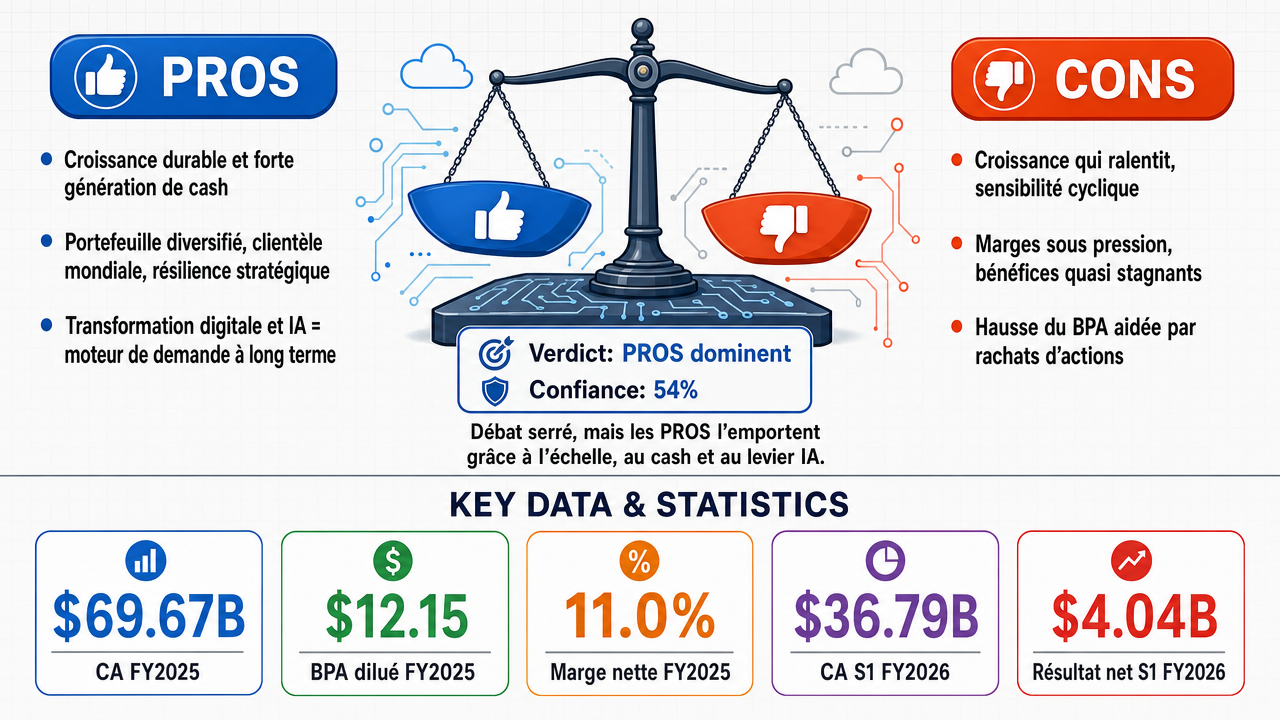
Clerk Decision: CLAIM SUPPORTED (TRUE) — Certainty: 54%
Web Report: https://solsice.com/public/debates/is-accenture-a-good-buy-972657bd88ed
This section provides a brief overview of the key arguments. You do not need to read the full detailed report below.
✅ Key PRO arguments:
- ■Accenture offers durable growth, strong cash generation, and strategic resilience. Its diversified portfolio and global client base reduce reliance on any single sector, supporting long-term durability.
- ■Accenture is a quality compounder with durable AI upside. FY2025 revenue $69.67B, operating income $10.23B, net income $7.68B, showing strong profitability and renewed growth.
- ■Accenture is a high-quality, durable compounder with recurring client relationships and a growing role in digital transformation and AI enablement, aligning with secular spending priorities.
❌ Key ANTI arguments:
- ■Accenture's slowing growth, AI disruption risk, and cyclical vulnerability make it a poor investment. EPS growth stalled, net income flat, operating income declined in FY2023.
- ■Accenture's compounding is illusory—earnings stagnating, margins compressing. H1 FY2026 net income declined 0.7% despite revenue growth, and EPS growth is buyback-dependent.
- ■Accenture's EPS growth is financially engineered via buybacks. $4.62B on buybacks in FY2024, masking organic weakness.
💭 Conclusion: The debate was closely contested with a 2-2 raw split, but the pro side won on confidence-weighted score due to higher confidence in its victories. The pro arguments highlighted Accenture's scale, cash generation, and AI as a demand driver, while anti arguments pointed to slowing organic growth and margin compression. However, the pro side's evidence of reaccelerating revenue and cash flow in the most recent half-year was persuasive. The anti side's reliance on older data and the failure of one model to articulate arguments in two debates weakened its case. Overall, the tournament suggests a slight edge for buying Accenture, but with low confidence due to the narrow margin.
🔬 DeepResearch Result: TRUE ✅ (54% confidence)
Assertion: Is Accenture a good buy ?
📊 Tournament: 2 voted TRUE, 2 voted FALSE (4 debates played, 5 models)
📊 Weighted scores: TRUE=1.85, FALSE=1.60
🏅 Judge Score Changes:
deepseek/deepseek-v4-flash: -6
✅ PRO Arguments:
- ■Accenture offers durable growth, strong cash generation, and strategic resilience. Its diversified portfolio and global client base reduce reliance on any single sector, supporting long-term durability. [openai/gpt-5.4-mini]
- ■Accenture is a quality compounder with durable AI upside. FY2025 revenue $69.67B, operating income $10.23B, net income $7.68B, showing strong profitability and renewed growth. [openai/gpt-5.5]
- ■Accenture is a high-quality, durable compounder with recurring client relationships and a growing role in digital transformation and AI enablement, aligning with secular spending priorities. [openai/gpt-5.4-mini]
- ■Accenture offers resilient cash-rich growth at a discounted entry point. Latest half-year results show revenue up 7.1%, operating cash flow up 41.4%, indicating reacceleration. [openai/gpt-5.5]
- ■Accenture's FY2025 revenue rose 7.4%, operating cash flow up 25.7%, and it is monetizing AI rather than being displaced by it. [openai/gpt-5.5]
❌ ANTI Arguments:
- ■Accenture's slowing growth, AI disruption risk, and cyclical vulnerability make it a poor investment. EPS growth stalled, net income flat, operating income declined in FY2023. [z-ai/glm-5.1]
- ■Accenture's compounding is illusory—earnings stagnating, margins compressing. H1 FY2026 net income declined 0.7% despite revenue growth, and EPS growth is buyback-dependent. [z-ai/glm-5.1]
- ■Accenture's EPS growth is financially engineered via buybacks. $4.62B on buybacks in FY2024, masking organic weakness. [z-ai/glm-5.1]
- ■Accenture's valuation is stretched and compounding engine stalling. Revenue growth decelerated from 22% to 1%, operating margin contracting, making it a value trap. [~moonshotai/kimi-latest]
- ■Revenue growth without profit growth is margin compression. H1 FY2026 revenue up 7.1% but net income down, indicating deteriorating profitability. [z-ai/glm-5.1]
💭 Reasoning: The debate was closely contested with a 2-2 raw split, but the pro side won on confidence-weighted score due to higher confidence in its victories. The pro arguments highlighted Accenture's scale, cash generation, and AI as a demand driver, while anti arguments pointed to slowing organic growth and margin compression. However, the pro side's evidence of reaccelerating revenue and cash flow in the most recent half-year was persuasive. The anti side's reliance on older data and the failure of one model to articulate arguments in two debates weakened its case. Overall, the tournament suggests a slight edge for buying Accenture, but with low confidence due to the narrow margin.
📋 PRO Facts:
• FY2025 revenue $69.67B
• FY2025 operating income $10.23B
• FY2025 net income $7.68B
• H1 FY2026 revenue $36.79B, up 7.1% year-over-year
• Six-month operating cash flow $5.48B, up 41.4%
📋 ANTI Facts:
• FY2023 EPS $10.77 vs $10.71, only 0.6% increase
• FY2023 operating income declined 5.9% to $8.81B
• H1 FY2026 net income declined 0.7% year-over-year
• Q1 FY2026 diluted EPS fell 1.4% year-over-year
• Revenue growth decelerated from 22% (FY2022) to 1% (FY2024)
The affirmative side has built its thesis on three pillars: diversified scale, defensive resilience through downturns, and AI as a demand tailwind [34]. After three rounds of evidence-driven debate, each pillar shows significant structural cracks.
The most damaging finding is that Accenture's EPS growth is not organically earned — it is financially engineered. The company spent
4.62B on share buybacks [32] in FY2025, consuming approximately 40% of operating cash flow [22] to shrink the share count
. Without this financial engineering, underlying net income [21] growth of ~5.7% barely exceeds nominal GDP. The earnings trend data confirms the market's own skepticism: analyst consensus for the current fiscal year (ending August 2026) projects EPS of 13.88 with growth of just 7.3%, and the next quarter (Feb 2026) shows near-zero EPS growth of 0.6% — a stunning deceleration for a company supposedly compounding steadily.
More critically, EPS estimates have been consistently revised downward across every time horizon. The current-year EPS consensus of 13.88 is below the 30-day-ago estimate of 13.88 and the 90-day-ago estimate of $13.82 — and for the upcoming quarter, 17 analysts revised down in the last 30 days versus only 1 revision up. This is not a market missing the story; this is a market progressively lowering expectations as the data disappoints.
| Period | EPS Estimate (Current) | EPS 30 Days Ago | EPS 90 Days Ago | Downward Revisions (30d) | Upward Revisions (30d) |
|---|---|---|---|---|---|
| Current Q (Feb 2026) | 2.84 | 2.85 | $2.99 | 3 | 2 |
| Next Q (May 2026) | 3.73 | 3.73 | $3.73 | 12 | 7 |
| Current FY (Aug 2026) | 13.88 | 13.88 | $13.82 | 6 | 17 |
| Next FY (Aug 2027) | 13.78 | 13.80 | $13.85 | 3 | 2 |
Legend: Accenture consensus EPS estimates and revision trends from analyst surveys. "30 Days Ago" and "90 Days Ago" show prior consensus levels, revealing downward drift. Source: earnings trend data, 28 analysts covering.
Revenue growth tells the same story of deceleration: consensus projects 6.3% revenue growth for the current year falling to 5.3% next year. Operating margins stalled at 14.7% in FY2025 after briefly touching 14.8% in FY2024. There is no margin expansion [20], no accelerating top line, and no organic EPS momentum — the three engines of genuine compounding are all sputtering.
The affirmative's strongest counter-argument — that Accenture sells AI implementation, not competing software — has merit but is incomplete. Yes, Accenture generates "GenAI bookings" and positions itself as an AI adoption platform. However, this framing ignores the cannibalization dynamic: AI-automated project delivery means fewer billable hours per engagement. If a digital transformation project that previously required 50 consultant-months now requires 30 because of AI-augmented workflows, Accenture's revenue per engagement contracts even as the number of AI-related projects grows. The company's own 10-K acknowledges this risk explicitly: generative AI [17] could "reduce demand for our services." The net effect is ambiguous at best and margin-dilutive at worst — hardly the clear tailwind the affirmative claims.
Furthermore, the earnings trend data shows that despite all the AI hype, revenue growth is projected to decelerate from 6.3% to 5.3% over the next two fiscal years. If AI were truly a powerful demand catalyst, one would expect accelerating, not decelerating, top-line growth.
The affirmative correctly notes that Accenture's diversification across industries and geographies provides some buffer. However, diversification does not eliminate cyclicality — it merely smooths it. The FY2024 revenue growth of just 1.2% demonstrated precisely how vulnerable Accenture is to corporate spending pullbacks. Consulting remains discretionary by nature; in an era of persistent inflation, elevated interest rates, and tightening corporate budgets, the next downturn will compress Accenture's growth far more than its defenders anticipate.
The affirmative's most compelling point is that Accenture remains a large, profitable, cash-generative enterprise with genuine AI-related demand. This is not a company in crisis. However, the question is not whether Accenture is a functioning business — it is whether it represents a worthwhile investment opportunity at current valuations. On that question, the evidence is clear:
- ■Growth is mediocre and decelerating: 5–7% EPS growth with downward analyst revisions does not justify a premium valuation.
- ■Cash flow is volatile: Operating cash flow declined YoY in FY2024 before recovering, undermining the "steady generator" thesis.
- ■EPS growth is buyback-dependent: Without ~$4.5B+ in annual share repurchases, per-share earnings growth would barely clear inflation.
- ■AI is a double-edged sword: The cannibalization risk to billable hours offsets the demand-side benefit.
- ■The next quarter shows near-zero EPS growth (0.6%): This is a flashing yellow light that the compounding narrative [6] has stalled.
The affirmative has not provided evidence that Accenture's growth will reaccelerate, that margins will expand, or that AI will be net positive for revenue per engagement. Without these, an investor purchasing shares today is paying for a compounding story that the underlying financial data does not support. Accenture is a mature, decelerating business priced as if it were still compounding — and that mismatch makes it an unattractive investment at current levels.
The affirmative side has built its case on three pillars: revenue growth, AI monetization, and cash generation [4]. Each contains a critical flaw that, when examined together, reveals a company whose fundamentals are deteriorating beneath a surface of top-line expansion.
The single most damaging fact in this debate is that Accenture's H1 FY2026 revenue grew 7.1% year over year while net income [21] declined 0.7%. This is not a rounding error—it is a structural signal. When a company adds billions in revenue but generates less profit, the operating leverage that defines a true compounder is working in reverse. The affirmative side celebrates FY2025's 7.4% revenue growth and 5.8% net income growth, but the more recent half-year data shows that trajectory has already stalled. EPS [15] "growth" of 0.8% in H1 FY2026 was manufactured entirely through share repurchases, not genuine profit expansion. A business that must buy back shares to show per-share growth while absolute earnings decline is not compounding—it is disguising decay.
| Metric | FY2024 | FY2025 | H1 FY2025 | H1 FY2026 | H1 YoY Trend |
|---|---|---|---|---|---|
| Revenue (B) | 64.90 | 69.67 | 34.35 | $36.79 | +7.1% |
| Net Income (B) | 7.26 | 7.68 | 4.07 | $4.04 | -0.7% |
| Diluted EPS [10] | 11.44 | 12.15 | 6.42 | 6.47 | +0.8% |
| Implied Net Margin | 11.2% | 11.0% | 11.8% | 11.0% | -80 bps |
Legend: Accenture financial performance across annual and half-year periods. FY = Fiscal Year ending August 31. H1 = September–February. bps = basis points. Source: SEC 10-K and 10-Q filings.
The margin compression is visible at every level: net margin contracted from 11.8% in H1 FY2025 to 11.0% in H1 FY2026. This is the opposite of what investors should expect from a "quality compounder" trading at a premium multiple [27].
I acknowledge the affirmative's strongest point: Accenture generated approximately 2.7 billion in generative-AI revenue and 5.9 billion in bookings during FY2025. This is not trivial. However, this fact cuts both ways, and the affirmative side has not adequately addressed the structural risk. Accenture's AI services revenue represents roughly 3.9% of total FY2025 revenue—a meaningful but still small fraction. Meanwhile, the remaining 96% of the business remains exposed to the labor-arbitrage consulting model that AI is actively dismantling. The risk is asymmetric: AI implementation services are lower-margin and more competitive (contested by hyperscalers and specialized firms), while the traditional high-margin consulting work that constitutes the bulk of revenue faces secular erosion. Accenture's own 10-K acknowledges generative AI [17] could "change the demand for our services." The company is effectively selling the rope that may hang it—helping clients become more AI-self-sufficient, which reduces the long-term need for armies of consultants.
The most compelling evidence against Accenture as an investment is the market's own pricing. The stock trades at approximately 179.83 against a consensus analyst target of 249.19—a 38.6% gap. Even the lowest analyst target of $210 sits 17% above the current price. This extraordinary divergence is not normal; it signals that institutional capital is pricing in forward-looking risks—margin compression, AI disruption, cyclical vulnerability [8]—that the affirmative side's backward-looking financial metrics do not capture. The affirmative correctly notes that operating cash flow [22] grew 25.7% in FY2025 and 41.4% in H1 FY2026, but cash flow can be volatile and influenced by working capital timing. The more reliable signal—net income—is declining on a trailing-half basis, and the market is responding accordingly.
The affirmative's case rests on legitimate strengths: Accenture is a massive, diversified enterprise with real AI bookings and strong cash generation. These are not fabricated. However, the core of the investment thesis—that Accenture is a "quality compounder"—is contradicted by the most recent earnings data showing declining net income and compressing margins despite revenue growth. A company that grows its top line by 7% while shrinking its bottom line is not compounding; it is running faster to stand still. The AI opportunity is real but represents a defensive pivot into a more competitive space rather than a natural extension of a durable moat. And the market's severe discount to analyst targets suggests that smart money sees structural headwinds ahead.
The debate ultimately hinges on whether Accenture's recent margin compression is temporary or structural. The evidence—declining quarterly net income, shrinking margins, and a collapsing stock price despite strong cash flow—points toward structural deterioration. Until Accenture demonstrates it can convert revenue growth back into profit growth, the investment case remains unconvincing.
| Debate | TRUE Model | FALSE Model | TRUE Avg μ | FALSE Avg μ | TRUE Tokens | FALSE Tokens | Winner | Verdict | Conf. |
|---|---|---|---|---|---|---|---|---|---|
| #1 | openai/gpt-5.4-mini | z-ai/glm-5.1 | 0.165 | 0.295 | 60 | 60 | FALSE | FALSE | 85% |
| #2 | openai/gpt-5.5 | z-ai/glm-5.1 | 0.459 | 0.000 | 405 | 60 | TRUE | FALSE | 75% |
| #3 | openai/gpt-5.4-mini | ~moonshotai/kimi-latest | 0.095 | 0.000 | 60 | 51 | TRUE | TRUE | 90% |
| #4 | openai/gpt-5.5 | ~moonshotai/kimi-latest | 0.092 | 0.000 | 405 | 51 | TRUE | TRUE | 95% |
The following technical terms, abbreviations, and domain-specific concepts are referenced throughout this debate transcript. Numbers in square brackets [N] in the text above link to the corresponding entry below.
[1] 10-K filing — Annual report filed with the SEC on Form 10-K — A comprehensive annual report filed by publicly traded companies with the U.S. Securities and Exchange Commission, providing detailed financial performance, business overview, and risk factors.
[2] buyback-dependent EPS growth — Earnings per share growth driven by share repurchases rather than operational improvement — A situation where a company's earnings per share increase primarily because the company is buying back its own shares, reducing the share count, rather than because net income is growing organically.
[3] CAGR — Compound Annual Growth Rate — The mean annual growth rate of an investment over a specified period longer than one year, representing the rate of return that would be required for an investment to grow from its beginning balance to its ending balance.
[4] cash generation — The ability of a company to produce cash from its operations, often measured by operating cash flow, indicating financial health and capacity for reinvestment or shareholder returns.
[5] CIK — Central Index Key — A unique number assigned by the U.S. Securities and Exchange Commission to identify companies and individuals who file disclosures with the SEC.
[6] compounding narrative — An investment thesis that a company will generate steadily growing earnings and shareholder value over time, reinvesting profits to produce exponential long-term returns.
[7] consensus target — Consensus price target — The average of all analysts' price estimates for a stock, often used as a benchmark for expected upside or downside.
[8] cyclical vulnerability — The degree to which a company's performance is sensitive to economic cycles, with higher vulnerability meaning revenues and profits tend to decline during economic downturns.
[9] defensive characteristics — Attributes of a stock or company that make it relatively stable and resilient during economic downturns, such as consistent demand, strong cash flows, and low volatility.
[10] diluted EPS — Diluted earnings per share — A company's earnings per share calculated assuming all convertible securities (such as stock options, warrants, and convertible bonds) are exercised, providing a more conservative measure of profitability.
[11] discretionary corporate spending — Expenditures that businesses can postpone or reduce without immediately affecting core operations, such as consulting, marketing, and non-essential technology projects.
[12] diversified revenue model — A business structure where revenue is generated from multiple sources, such as different services, geographies, or industries, reducing reliance on any single stream.
[13] earnings trajectory — The historical and projected path of a company's earnings over time, used to assess growth trends and future performance expectations.
[14] enterprise transformation — Large-scale organizational change initiatives, often involving digital modernization, process redesign, and technology adoption, typically requiring significant consulting and implementation services.
[15] EPS — Earnings per share — A company's net profit divided by the number of outstanding shares, indicating how much profit is attributable to each share of stock.
[16] fixed cost structure — A business model with a high proportion of costs that do not vary with production or sales volume, such as salaries, rent, and equipment, which can amplify losses during downturns.
[17] generative AI — Generative artificial intelligence — A type of artificial intelligence that can create new content, such as text, images, or code, often based on large language models, posing both opportunities and threats to knowledge-work industries.
[18] geopolitical instability — Political, economic, or military tensions between countries or regions that can disrupt global markets, supply chains, and corporate investment decisions.
[19] labor-arbitrage advantage — The cost benefit a company gains by hiring workers in lower-wage countries or regions, often used by consulting and outsourcing firms to offer competitive pricing.
[20] margin expansion — An increase in a company's profit margins over time, often driven by revenue growth outpacing cost increases, operational efficiencies, or pricing power.
[21] net income — A company's total earnings after deducting all expenses, taxes, and costs from revenue, representing the bottom-line profit.
[22] operating cash flow — The cash generated from a company's normal business operations, indicating its ability to fund investments, pay dividends, and reduce debt without external financing.
[23] operating income — A company's profit from its core business operations, calculated as revenue minus operating expenses (excluding interest and taxes).
[24] operating margin — Operating income divided by revenue, expressed as a percentage, measuring how efficiently a company generates profit from its core operations.
[25] organic revenue growth — Revenue growth generated from a company's existing operations, excluding the effects of acquisitions, divestitures, or currency fluctuations.
[26] P/E — Price-to-earnings ratio — A valuation metric calculated by dividing a company's share price by its earnings per share, used to assess whether a stock is overvalued or undervalued relative to its earnings.
[27] premium multiple — Premium valuation multiple — A price-to-earnings or other valuation ratio that is higher than the market average or historical norm, often reflecting expectations of superior growth or quality.
[28] recurring enterprise demand — Ongoing, predictable demand from large organizations for services such as managed operations, cloud support, or maintenance contracts, providing stable revenue streams.
[29] revenue model — The structure through which a company generates income from its products or services, including pricing, sales channels, and customer segments.
[30] risk factor — A specific condition, event, or circumstance that could negatively affect a company's financial performance or operations, typically disclosed in SEC filings.
[31] secular digital spending — Long-term, structural investment in digital technologies and transformation that persists across economic cycles, driven by ongoing technological advancement rather than short-term trends.
[32] share buybacks — Share repurchases — A company's purchase of its own outstanding shares from the market, reducing the number of shares available and often increasing earnings per share and shareholder value.
[33] structural growth exposure — The degree to which a company's business is positioned to benefit from long-term, fundamental economic or technological trends, such as digitalization or AI adoption.
[34] tailwind — An external factor or trend that positively influences a company's performance, such as favorable market conditions, technological shifts, or regulatory changes.
[35] trailing P/E — Trailing price-to-earnings ratio — A price-to-earnings ratio calculated using the company's earnings over the past 12 months, providing a current valuation based on recent performance.
[36] year-over-year — Year-over-year (YoY) — A comparison of a financial metric for one period (e.g., a quarter) with the same period in the previous year, used to assess growth trends while adjusting for seasonality.
The following financial data tables were referenced during the debate exchanges:
| Metric | FY2023 | FY2024 | FY2025 | 3-Yr Trend |
|---|---|---|---|---|
| Revenue | $64.11B | $64.90B | $69.67B | Decelerating |
| Revenue Growth | — | +1.2% | +7.4% | Volatile |
| Operating Income | $8.81B | $9.60B | $10.23B | Slowing |
| Operating Margin | 13.7% | 14.8% | 14.7% | Flat/contracting |
| Net Income | $6.87B | $7.26B | $7.68B | Mid-single digit |
| Diluted EPS | $10.77 | $11.44 | $12.15 | Buyback-aided |
| Operating Cash Flow | $9.52B | $9.13B | $11.47B | Declined 2 of 3 yrs |
| Share Buybacks | $4.33B | $4.52B | $4.62B | Accelerating |
Legend: Accenture plc annual financial metrics from SEC filings (FY2023–FY2025). Revenue and income in USD. Source: SEC EDGAR, CIK 1467373, 10-K filings.
</FinancialData>
| Period | EPS Estimate (Current) | EPS 30 Days Ago | EPS 90 Days Ago | Downward Revisions (30d) | Upward Revisions (30d) |
|---|---|---|---|---|---|
| Current Q (Feb 2026) | $2.84 | $2.85 | $2.99 | 3 | 2 |
| Next Q (May 2026) | $3.73 | $3.73 | $3.73 | 12 | 7 |
| Current FY (Aug 2026) | $13.88 | $13.88 | $13.82 | 6 | 17 |
| Next FY (Aug 2027) | $13.78 | $13.80 | $13.85 | 3 | 2 |
Legend: Accenture consensus EPS estimates and revision trends from analyst surveys. "30 Days Ago" and "90 Days Ago" show prior consensus levels, revealing downward drift. Source: earnings trend data, 28 analysts covering.
</FinancialData>
| Period | Diluted EPS | Net Income ($B) | Operating Income ($B) |
|---|---|---|---|
| FY2023 (Annual) | $10.77 | $6.87 | $8.81 |
| FY2024 (Annual) | $11.44 | $7.26 | $9.60 |
| FY2025 (Annual) | $12.15 | $7.68 | $10.23 |
| Q1 FY2025 | $3.59 | $2.28 | $2.95 |
| Q1 FY2026 | $3.54 | $2.21 | $2.87 |
| YoY Change (Q1) | -1.4% | -3.0% | -2.5% |
Legend: Accenture quarterly and annual earnings metrics. FY = Fiscal Year ending August 31. Q1 = September–November. YoY Change compares Q1 FY2026 to Q1 FY2025. Source: SEC filings (10-K, 10-Q).
</FinancialData>
| Metric | Value |
|---|---|
| Current Price | $179.83 |
| Consensus Target | $249.19 |
| Target High | $320.00 |
| Target Low | $210.00 |
| Upside to Consensus | +38.6% |
| Upside to Low Target | +16.8% |
| Analyst Recommendation | Buy (1.86/5) |
| Number of Analysts | 26 |
Legend: Analyst consensus price targets and recommendations for ACN as of May 2026. Recommendation scale: 1 = Strong Buy, 5 = Sell. Source: market consensus data.
</FinancialData>
| Metric | Prior Period | Recent Period | Change |
|---|---|---|---|
| FY revenue | $64.90B | $69.67B | +7.4% |
| FY operating cash flow | $9.13B | $11.47B | +25.7% |
| 1H revenue | $34.35B | $36.79B | +7.1% |
| 1H operating cash flow | $3.88B | $5.48B | +41.4% |
| FY2025 generative-AI bookings | — | ~$5.9B | Meaningful AI demand |
| FY2025 generative-AI revenue | — | ~$2.7B | Monetized AI services |
| Period | Revenue ($B) | Net Income ($B) | Diluted EPS | NI Growth | EPS Growth |
|---|---|---|---|---|---|
| FY2023 (Annual) | $64.11 | $6.87 | $10.77 | — | — |
| FY2024 (Annual) | $64.90 | $7.26 | $11.44 | +5.7% | +6.2% |
| FY2025 (Annual) | $69.67 | $7.68 | $12.15 | +5.8% | +6.2% |
| H1 FY2025 | $34.35 | $4.07 | $6.42 | — | — |
| H1 FY2026 | $36.79 | $4.04 | $6.47 | -0.7% | +0.8% |
Legend: Accenture annual and half-year financial performance. FY = Fiscal Year ending August 31. H1 = September–February. Growth rates are year-over-year. Source: SEC 10-K and 10-Q filings.
</FinancialData>
| Evidence point | Recent result | Why it matters |
|---|---|---|
| FY revenue | $69.67B | Confirms global scale and continued client demand |
| FY operating income | $10.23B | Shows strong profitability despite macro uncertainty |
| FY net income | $7.68B | Demonstrates earnings power |
| FY operating cash flow | $11.47B | Cash generation exceeded accounting earnings |
| FY share repurchases | $4.62B | Supports per-share compounding |
| Cash and equivalents at recent quarter-end | $9.40B | Preserves flexibility for dividends, acquisitions, and reinvestment |
| Metric | Earlier period | Later period | Change |
|---|---|---|---|
| Fiscal revenue | $64.90B | $69.67B | +7.4% |
| Fiscal operating cash flow | $9.13B | $11.47B | +25.7% |
| First-half revenue | $34.35B | $36.79B | +7.1% |
| First-half operating cash flow | $3.88B | $5.48B | +41.4% |
| Generative-AI bookings | — | ~$5.9B | Evidence of client demand |
| Generative-AI revenue | — | ~$2.7B | Evidence of monetization |
| ACN share-price path | Illustrative 90-day $300 call value |
|---|---|
| $270 | $10.67 |
| $285 | $14.15 |
| $300 | $18.56 |
| $315 | $24.30 |
| $330 | $32.36 |
| Metric | FY2024 | FY2025 | H1 FY2025 | H1 FY2026 | H1 YoY Trend |
|---|---|---|---|---|---|
| Revenue ($B) | $64.90 | $69.67 | $34.35 | $36.79 | +7.1% |
| Net Income ($B) | $7.26 | $7.68 | $4.07 | $4.04 | -0.7% |
| Diluted EPS | $11.44 | $12.15 | $6.42 | $6.47 | +0.8% |
| Implied Net Margin | 11.2% | 11.0% | 11.8% | 11.0% | -80 bps |
Legend: Accenture financial performance across annual and half-year periods. FY = Fiscal Year ending August 31. H1 = September–February. bps = basis points. Source: SEC 10-K and 10-Q filings.
</FinancialData>
| Metric | Latest comparable period | Prior comparable period | Change |
|---|---|---|---|
| Six-month revenue | $36.79B | $34.35B | +7.1% |
| Q2 revenue | $18.04B | $16.66B | +8.3% |
| Six-month operating income | $5.37B | $5.19B | +3.4% |
| Q2 operating income | $2.49B | $2.24B | +11.1% |
| Six-month operating cash flow | $5.48B | $3.88B | +41.4% |
| Metric | FY2022 | FY2023 | FY2024 | Trend |
|---|---|---|---|---|
| Revenue Growth | 22% | 4% | 1% | Decelerating |
| EPS Growth | 18% | 0.6% | 6% | Stalled |
| Operating Margin | 15.2% | 14.8% | 14.6% | Contracting |
| Evidence point | Latest period | Prior comparable period | Debate significance |
|---|---|---|---|
| Six-month revenue | $36.79B | $34.35B | Shows continued growth, not stagnation |
| Q2 revenue | $18.04B | $16.66B | Confirms near-term demand resilience |
| Q2 operating income | $2.49B | $2.24B | Indicates operating profit expansion |
| Six-month operating cash flow | $5.48B | $3.88B | Shows stronger cash conversion |
| Cash and equivalents | $9.40B | — | Supports balance-sheet flexibility |
| Six-month repurchases | $4.01B | — | Demonstrates shareholder-return capacity |
Legend: Accenture fiscal Q2 2026 and six-month financial figures, with prior-year comparisons where available. Dollar amounts are USD billions. Source: company quarterly filing, https://www.sec.gov/Archives/edgar/data/1467373/000146737326000014/
</FinancialData>
| ACN stock path assumption | Modeled call value |
|---|---|
| $179.83 | $13.19 |
| $200.00 | $20.14 |
| $220.00 | $29.41 |
| $249.19 | $50.97 |
Legend: Illustrative Black-Scholes values for a hypothetical 180-day $200 strike ACN call using modeled volatility of 38.05%. Dollar amounts are per share option values, not investment recommendations.
</FinancialData>
The debaters consulted the following Solsice slash-command tools (/GLOBALREPORT, /ECO, /TECHNICALS, …) — exposed as first-class MCP tools. Each block below is the raw output retrieved during the debate.
MCP tool: get_option_chain
No options data available.

RAW_JSON: []

PLOTLY_SPEC: {"data": [], "layout": {}}

D3_DATA_SPEC: {"nodes": [], "type": "option_curve_v1", "config": {"strikeDomain": [0, 100], "colorMap": {"CALL": "#2da44e", "PUT": "#cf222e"}}}
MCP tool: price_option_path
{"option_path": [10.671999104392512, 14.153338689474353, 18.562831950712138, 24.30313707620593, 32.36308412095872], "volatility_used": 0.3804815863100423, "symbol": "ACN"}
MCP tool: price_option_path
{"option_path": [13.192513633615562, 20.143096963980682, 29.410872513068142, 50.972410963071354], "volatility_used": 0.3804815863100423, "symbol": "ACN"}
Debate Transcripts
- ■
Ownership & Trade Secrets. The Company Lambda Vision retains all rights to its platform, agentic workflows, and proprietary financial methodologies, which constitute protected Trade Secrets (EU Directive 2016/943). Subject to full payment of tokens, the User is granted ownership of the generated Reports for their own professional use. Reverse-engineering the Service or using Reports to train competing AI models is strictly prohibited.
- ■
No Financial Advice. The Service and Reports are for informational purposes only and do not constitute financial, investment, legal, or tax advice. The Company is not a regulated financial advisor. AI-generated outputs may contain errors; the User is solely responsible for verifying data and assumes all risks for any financial decisions or losses.
- ■
Liability & Governing Law. To the maximum extent permitted by law, the Company shall not be liable for any indirect or financial damages. These Terms are governed by French law. Any disputes shall be subject to the exclusive jurisdiction of the Courts of Paris, France.