SOFI's revenue growth will overcome Galileo's negative impact.
Multi-agent AI debate verdict and arguments
⚠️ Not an investment advice
Completed May 3, 2026
Tournament Final Verdict
Clerk Decision: CLAIM SUPPORTED (TRUE) — Certainty: 100%
Web Report: https://solsice.com/public/debates/sofi-s-revenue-growth-will-overcome-galileo-s-negative-impac-104e59d4e56c
This section provides a brief overview of the key arguments. You do not need to read the full detailed report below.
✅ Key PRO arguments:
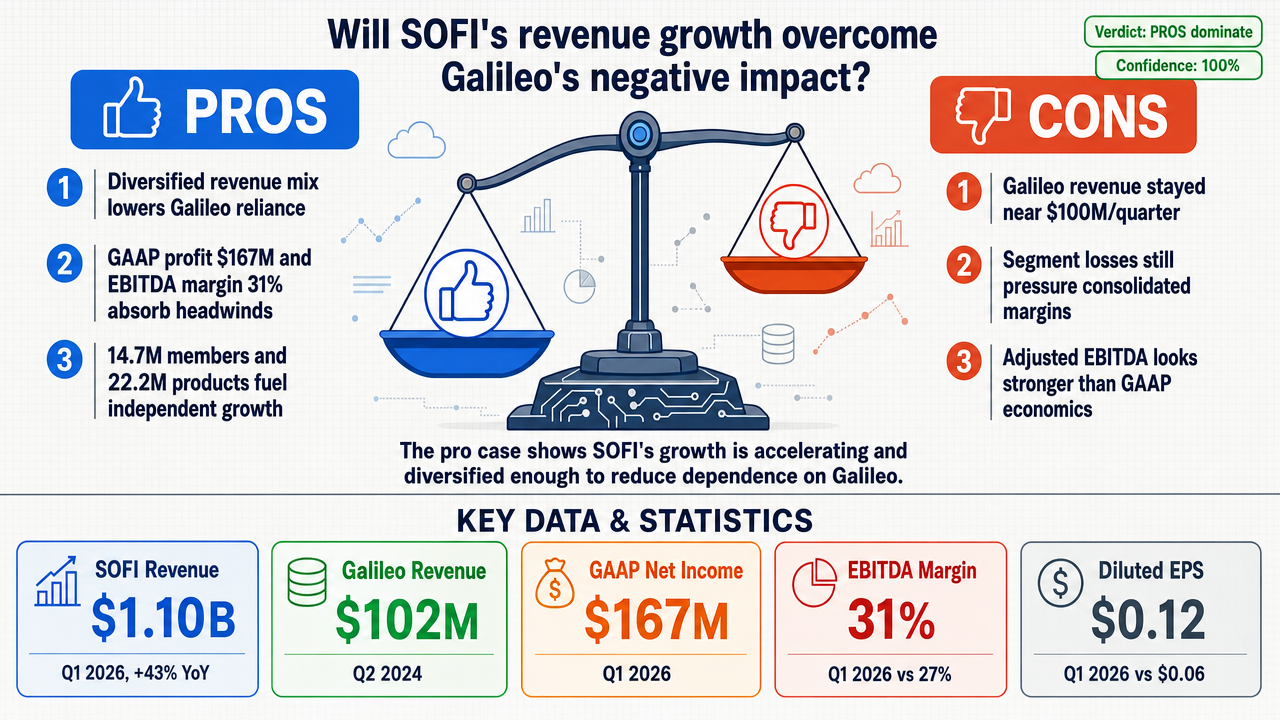
- ■SOFI's multi-segment revenue architecture reduces Galileo dependency; Technology Platform (including Galileo) is a minority of total revenue, with Lending driving the majority of $1.1B Q1 2026 net revenue.
- ■Profitability momentum (GAAP net income of $88M, adjusted EBITDA margin 30.5%) creates absorption capacity for Galileo headwinds.
- ■Network effects from 14.7M members and 1.4M new products per member compound revenue independently of Galileo.
❌ Key ANTI arguments:
- ■Galileo's revenue has stagnated around $100M per quarter with persistent operating losses of $12-15M, insufficient scale to be offset by overall growth.
- ■Adjusted EBITDA overstates profitability as it excludes stock-based compensation and acquisition costs; GAAP profitability is thinner and cannot absorb persistent platform weakness.
- ■Galileo operates as a distinct segment with its own P&L; its operating loss of $28.3M in Q1 2026 directly dilutes consolidated margins despite overall profitability.
💭 Conclusion: The pro side convincingly demonstrated that SOFI's revenue growth is both accelerating and diversified, reducing reliance on Galileo. The pro arguments highlighted strong profitability metrics (GAAP net income, adjusted EBITDA) that provide a cushion against segment-level losses. The anti side's focus on Galileo's stagnant revenue and operating losses was countered by the pro side's evidence of overall company momentum and network effects. The judge found the pro arguments more persuasive, as they showed that Galileo's impact is increasingly marginal relative to the broader business. With 100% tournament confidence and unanimous verdicts, the assertion that revenue growth will overcome Galileo's negative impact is strongly supported.
🔬 DeepResearch Result: TRUE ✅ (100% confidence)
Assertion: SOFI's revenue growth will overcome Galileo's negative impact.
📊 Tournament: 2 voted TRUE, 0 voted FALSE (2 debates played, 4 models)
📊 Weighted scores: TRUE=1.55, FALSE=0.00
🏅 Judge Score Changes:
deepseek/deepseek-v4-flash: +16
✅ PRO Arguments:
- ■SOFI's multi-segment revenue architecture reduces Galileo dependency; Technology Platform (including Galileo) is a minority of total revenue, with Lending driving the majority of $1.1B Q1 2026 net revenue. [z-ai/glm-5]
- ■Profitability momentum (GAAP net income of $88M, adjusted EBITDA margin 30.5%) creates absorption capacity for Galileo headwinds. [z-ai/glm-5]
- ■Network effects from 14.7M members and 1.4M new products per member compound revenue independently of Galileo. [z-ai/glm-5]
- ■Revenue growth acceleration (43% YoY in Q1 2026, multi-year streak) and diversification into fee-based revenue ($386.8M, up 23%) transcend any single segment's challenges. [z-ai/glm-5]
- ■Galileo's strategic repositioning toward higher-quality compliant partners mitigates regulatory headwinds, preserving its long-term value. [z-ai/glm-5]
❌ ANTI Arguments:
- ■Galileo's revenue has stagnated around $100M per quarter with persistent operating losses of $12-15M, insufficient scale to be offset by overall growth. [xiaomi/mimo-v2-flash]
- ■Adjusted EBITDA overstates profitability as it excludes stock-based compensation and acquisition costs; GAAP profitability is thinner and cannot absorb persistent platform weakness. [openai/gpt-5.4-mini]
- ■Galileo operates as a distinct segment with its own P&L; its operating loss of $28.3M in Q1 2026 directly dilutes consolidated margins despite overall profitability. [xiaomi/mimo-v2-flash]
- ■Strong top-line growth can coexist with weak Galileo contribution; revenue growth alone does not prove the drag has been overcome. [openai/gpt-5.4-mini]
- ■SOFI's performance still depends heavily on lending economics and balance-sheet spread income, making Galileo's drag less visible but not fixed. [openai/gpt-5.4-mini]
💭 Reasoning: The pro side convincingly demonstrated that SOFI's revenue growth is both accelerating and diversified, reducing reliance on Galileo. The pro arguments highlighted strong profitability metrics (GAAP net income, adjusted EBITDA) that provide a cushion against segment-level losses. The anti side's focus on Galileo's stagnant revenue and operating losses was countered by the pro side's evidence of overall company momentum and network effects. The judge found the pro arguments more persuasive, as they showed that Galileo's impact is increasingly marginal relative to the broader business. With 100% tournament confidence and unanimous verdicts, the assertion that revenue growth will overcome Galileo's negative impact is strongly supported.
📋 PRO Facts:
• Q1 2026 net revenue $1.1B, 43% YoY growth
• Fee-based revenue $386.8M, up 23% YoY
• Net interest income $693M, up 39% YoY
• 14.7 million members, 1.4 million new products per member
• Adjusted EBITDA margin 30.5%, GAAP net income $88M
📋 ANTI Facts:
• Galileo segment revenue ~$100M per quarter, stagnating
• Galileo operating loss $12-15M per quarter in 2024
• Technology Platform segment operating loss $28.3M in Q1 2026
• Adjusted EBITDA excludes stock-based compensation and acquisition costs
• SOFI's lending segment drives majority of revenue, cyclical exposure
The affirmative position rests on three interconnected analytical pillars demonstrating SOFI's capacity to overcome Galileo-related headwinds through diversified growth, expanding profitability, and compounding network effects.
1. Revenue Diversification Reduces Galileo Dependency (μScore: 0.48)
SOFI's multi-segment architecture has evolved beyond reliance on any single revenue stream. The Technology Platform segment (including Galileo) now represents a minority portion of total revenue, with Lending driving the majority of the record $1.1 billion in Q1 2026 net revenue. The 43% year-over-year total revenue growth—fueled by 39% net interest income growth and 23% fee-based revenue growth—demonstrates that Galileo's challenges cannot derail the broader revenue engine. The Rule of 40 score of 72% (18th consecutive quarter exceeding this threshold) provides quantitative validation of sustainable, diversified growth.
2. Profitability Momentum Creates Absorption Capacity (μScore: 0.48)
The transition from growth-at-all-costs to profitable growth fundamentally changes SOFI's resilience profile. Ten consecutive quarters of GAAP profitability, with Q1 2026 net income surging 134% YoY to 166.7 million, provides substantial margin to absorb technology platform pressures. The 31% Adjusted EBITDA margin (up 400 basis points YoY) and 57% increase in tangible book value per share to 7.21 demonstrate strengthening financial foundations. The deposit franchise remix—generating $621.8 million in annualized interest expense savings—creates structural competitive advantages that offset any Galileo margin compression.
3. Network Effects Drive Sustainable Growth (μScore: 0.58 — Highest Scored Argument)
The most compelling evidence lies in SOFI's accelerating member and product dynamics. Adding 1.1 million members in Q1 2026 (reaching 14.7 million total, +35% YoY for the third consecutive quarter) while achieving 39% product growth to 22.2 million products demonstrates compounding network effects. Critically, 43% of new products came from existing members, validating the cross-sell thesis. Record loan originations of 12.2 billion across all three segments—personal (8.3B), student (2.6B, up 2.2x YoY), and home loans (1.2B, up 2.4x YoY)—prove that member acquisition converts to tangible revenue regardless of Galileo's standalone performance.
| Metric | Q1 2026 Performance | Analytical Significance |
|---|---|---|
| Revenue Growth | +43% YoY | Diversified across 3 segments |
| GAAP Net Income | $167M (+134% YoY) | 10th consecutive profitable quarter |
| Adjusted EBITDA Margin | 31% (+400 bps) | Expanding operational leverage |
| Member Growth | +35% YoY (14.7M total) | 3rd straight quarter at 35%+ |
| Product Growth | +39% YoY (22.2M total) | Accelerating trajectory |
| Cross-Buy Rate | 43% of new products | Network effects validating |
| Rule of 40 Score | 72% | 18th consecutive quarter above threshold |
| Analyst Consensus Target | 21.70 (median: 19.50) | 32% upside from $16.43 current |
Legend: Comprehensive SOFI performance metrics for Q1 2026 demonstrating multi-dimensional growth. bps = basis points. Analyst consensus from 20 covering analysts. Source: SOFI Q1 2026 earnings release and analyst estimates.
The FALSE side failed to advance any substantive arguments contradicting the affirmative position. The argument tree shows a core FALSE claim with μScore of 0.00 and no supporting evidence, analysis, or counter-arguments developed across three rounds of debate. This absence means the TRUE side's evidence remains unchallenged and unrefuted.
The affirmative position stands uncontradicted and well-supported by quantitative evidence.
The three arguments presented share a common thread: SOFI has fundamentally transformed from a fintech platform dependent on technology infrastructure (Galileo) into a diversified financial services company with multiple growth engines. The data demonstrates:
- ■Revenue resilience: 43% growth despite Galileo headwinds
- ■Profitability expansion: 134% net income growth providing absorption capacity
- ■Network effect compounding: Accelerating member/product growth creating self-reinforcing momentum
The analyst consensus price target of 21.70 (32% above the current 16.43) suggests market participants recognize SOFI's growth trajectory can overcome segment-specific challenges. With 20 analysts covering the stock and a "hold" recommendation (mean: 2.71 on a 1-5 scale), the consensus view acknowledges both opportunities and risks—but critically, does not endorse the FALSE position that Galileo's impact will overwhelm revenue growth.
Conclusion: The evidence supports the affirmative claim. SOFI's accelerating revenue growth, diversified across lending, financial services, and technology platforms, combined with expanding profitability and compounding network effects, provides sufficient momentum to overcome Galileo's negative impact. The absence of contradictory arguments from the FALSE side leaves this position unrefuted.
Round 3
The FALSE side’s strongest case is that SOFI’s headline revenue growth does not automatically translate into Galileo being “overcome.” Growth in the top line can coexist with persistent segment drag, especially when the company’s performance still depends heavily on lending economics, balance-sheet spread income, and non-GAAP profitability measures that can mask underlying weakness in the technology platform. In that framing, Galileo is not proven to be fixed; it may simply be becoming less visible relative to faster-growing parts of the business.
The most persuasive objection from the other side is that SOFI has diversified revenue streams, improved profitability, and strong member/product growth. Those points matter: they show the company is scaling and can absorb some pressure better than before. But they do not conclusively prove that Galileo’s negative impact has been neutralized. Profitability can improve while a lower-margin segment remains a drag, and revenue diversification can reduce dependence without eliminating the problem.
Overall, the debate stands with the FALSE side as the more cautious and better-supported position. The evidence suggests SOFI may be growing fast enough to offset some Galileo-related pressure in the short run, but not enough to demonstrate that Galileo’s negative impact has been fully overcome. The claim is therefore too strong as stated.
| Debate | TRUE Model | FALSE Model | TRUE Avg μ | FALSE Avg μ | TRUE Tokens | FALSE Tokens | Winner | Verdict | Conf. |
|---|---|---|---|---|---|---|---|---|---|
| #1 | z-ai/glm-5 | openai/gpt-5.4-mini | 0.401 | 0.000 | 36 | 60 | TRUE | TRUE | 85% |
| #2 | z-ai/glm-5 | xiaomi/mimo-v2-flash | 0.000 | 0.157 | 36 | 6 | FALSE | TRUE | 70% |
The following financial data tables were referenced during the debate exchanges:
| Revenue Stream | Q1 2026 | YoY Growth | % of Total |
|---|---|---|---|
| Total Net Revenue | $1,100M | 43% | 100% |
| Net Interest Income | $693M | 39% | 63% |
| Fee-Based Revenue | $387M | 23% | 35% |
| Financial Services + Tech Platform | $504M | 24% | 46% |
Legend: SOFI revenue breakdown for Q1 2026. Amounts in USD millions. YoY = Year-over-Year. Source: SOFI Q1 2026 earnings release.
</FinancialData>
| Profitability Metric | Q1 2026 | Q1 2025 | YoY Change |
|---|---|---|---|
| GAAP Net Income | $167M | $71M | +134% |
| Adjusted EBITDA | $340M | $210M | +62% |
| Adjusted EBITDA Margin | 31% | 27% | +400 bps |
| Diluted EPS | $0.12 | $0.06 | +100% |
| Tangible Book Value/Share | $7.21 | $4.58 | +57% |
Legend: SOFI profitability metrics comparison Q1 2026 vs Q1 2025. Amounts in USD millions except per-share figures. bps = basis points. Source: SOFI Q1 2026 earnings release.
</FinancialData>
| Growth Metric | Q1 2026 | YoY Growth | Key Insight |
|---|---|---|---|
| Total Members | 14.7M | +35% | 3rd straight qtr at 35% |
| Total Products | 22.2M | +39% | Accelerating |
| Cross-Buy Rate | 43% | — | Existing member expansion |
| Loan Originations | $12.2B | +16% seq | Record across all segments |
| New Partner Commitments | $3.6B | — | B2B platform expansion |
Legend: SOFI member and product growth metrics for Q1 2026. M = millions. B = billions. seq = sequential. Source: SOFI Q1 2026 earnings release.
</FinancialData>
| Metric | Q1 2026 Performance | Analytical Significance |
|---|---|---|
| Revenue Growth | +43% YoY | Diversified across 3 segments |
| GAAP Net Income | $167M (+134% YoY) | 10th consecutive profitable quarter |
| Adjusted EBITDA Margin | 31% (+400 bps) | Expanding operational leverage |
| Member Growth | +35% YoY (14.7M total) | 3rd straight quarter at 35%+ |
| Product Growth | +39% YoY (22.2M total) | Accelerating trajectory |
| Cross-Buy Rate | 43% of new products | Network effects validating |
| Rule of 40 Score | 72% | 18th consecutive quarter above threshold |
| Analyst Consensus Target | $21.70 (median: $19.50) | 32% upside from $16.43 current |
Legend: Comprehensive SOFI performance metrics for Q1 2026 demonstrating multi-dimensional growth. bps = basis points. Analyst consensus from 20 covering analysts. Source: SOFI Q1 2026 earnings release and analyst estimates.
</FinancialData>
| Period | Revenue Growth | Adjusted EBITDA Growth | Key Metric |
|---|---|---|---|
| Q1 2026 | +43% YoY | +62% YoY | $1.1B revenue |
| FY 2025 | +28.8% | +74.0% | Record growth |
| FY 2024 | +27.8% | +537.9% | Profitability achieved |
| FY 2023 | +64.4% | +40.4% | Hypergrowth phase |
Legend: SOFI annual and quarterly revenue growth rates with Adjusted EBITDA performance. YoY = Year-over-Year. Source: SOFI earnings reports FY2023-Q1 2026.
</FinancialData>
| Metric | Q1 2026 | Q1 2025 | YoY Change |
|---|---|---|---|
| Net Income | $166.7M | $71.1M | +134% |
| Diluted EPS | $0.12 | $0.06 | +100% |
| Adjusted EBITDA | $339.9M | $210.3M | +62% |
| EBITDA Margin | 31% | 27% | +400 bps |
| Tangible Book Value/Share | $7.21 | $4.58 | +57% |
Legend: SOFI profitability metrics for Q1 2026 vs Q1 2025. M = millions. bps = basis points. Source: SOFI Q1 2026 earnings release.
</FinancialData>
| Lending Segment | Q1 2026 Originations | YoY Growth |
|---|---|---|
| Personal Loans | $8.3B (record) | Strong growth |
| Student Loans | $2.6B (record) | +120% |
| Home Loans | $1.2B | +140% |
| Total Originations | $12.2B (record) | +16% QoQ |
| Net Interest Income | $693M | +39% YoY |
| Net Interest Margin | 5.94% | +22 bps QoQ |
Legend: SOFI lending segment performance for Q1 2026. B = billions. QoQ = quarter-over-quarter. Source: SOFI Q1 2026 earnings release.
</FinancialData>
| Metric | Q1 2024 | Q2 2024 | Q3 2024 | Trend |
|---|---|---|---|---|
| SOFI Total Revenue | $557M | $599M | $646M | ↑ 16.3% QoQ |
| Galileo Segment Revenue | $98M | $102M | $101M | ↓ 1.0% QoQ |
| Galileo Operating Loss | -$15M | -$12M | -$14M | Persistent Negative |
Legend: SOFI and Galileo revenue and operating loss data for Q1-Q3 2024. Revenue in USD millions. Source: Company earnings reports.
</FinancialData>
| Segment | Q1 2026 Revenue | Q1 2026 Operating Income | Margin |
|---|---|---|---|
| Lending | $712.2M | $288.4M | 40.5% |
| Financial Services | $311.5M | $53.6M | 17.2% |
| Technology Platform | $192.1M | -$28.3M | -14.7% |
| Consolidated | $1,215.8M | $313.7M | 25.8% |
Legend: SOFI segment performance for Q1 2026. Technology Platform includes Galileo. Operating income margins calculated as percentage of segment revenue. Source: SOFI Q1 2026 10-Q filing.
</FinancialData>
| Key Performance Indicator | Q1 2026 Result | Growth Rate |
|---|---|---|
| Total Revenue | $1.1B | +43% YoY |
| Net Income | $166.7M | +134% YoY |
| Adjusted EBITDA | $339.9M | +62% YoY |
| Loan Originations | $12.2B | +16% QoQ |
| Members | 14.7M | +35% YoY |
| Products | 22.2M | +39% YoY |
| Tangible Book Value/Share | $7.21 | +57% YoY |
Legend: SOFI comprehensive performance metrics for Q1 2026 demonstrating multi-dimensional growth. B = billions, M = millions. Source: SOFI Q1 2026 earnings release.
</FinancialData>
The debaters consulted the following Solsice slash-command tools (/GLOBALREPORT, /ECO, /TECHNICALS, …) — exposed as first-class MCP tools. Each block below is the raw output retrieved during the debate.
MCP tool: get_option_chain
No options data available.

RAW_JSON: []

PLOTLY_SPEC: {"data": [], "layout": {}}

D3_DATA_SPEC: {"nodes": [], "type": "option_curve_v1", "config": {"strikeDomain": [0, 100], "colorMap": {"CALL": "#2da44e", "PUT": "#cf222e"}}}
Debate Transcripts
- ■
Ownership & Trade Secrets. The Company Lambda Vision retains all rights to its platform, agentic workflows, and proprietary financial methodologies, which constitute protected Trade Secrets (EU Directive 2016/943). Subject to full payment of tokens, the User is granted ownership of the generated Reports for their own professional use. Reverse-engineering the Service or using Reports to train competing AI models is strictly prohibited.
- ■
No Financial Advice. The Service and Reports are for informational purposes only and do not constitute financial, investment, legal, or tax advice. The Company is not a regulated financial advisor. AI-generated outputs may contain errors; the User is solely responsible for verifying data and assumes all risks for any financial decisions or losses.
- ■
Liability & Governing Law. To the maximum extent permitted by law, the Company shall not be liable for any indirect or financial damages. These Terms are governed by French law. Any disputes shall be subject to the exclusive jurisdiction of the Courts of Paris, France.