
US large cap stocks will generate negative 6% real returns over the next seven years, according to GMO's forecast.
AI debate verdict and arguments
⚠️ AI-generated information only; not professional advice
Completed October 26, 2026
Verdict
Verdict: likely FALSE (80%)
Web Report: https://solsice.com/public/debates/us-large-cap-stocks-will-generate-negative-6-real-returns-ov-2754e24928ef
This section provides a brief overview of the key arguments. You do not need to read the full detailed report below.
✅ Key PRO arguments:
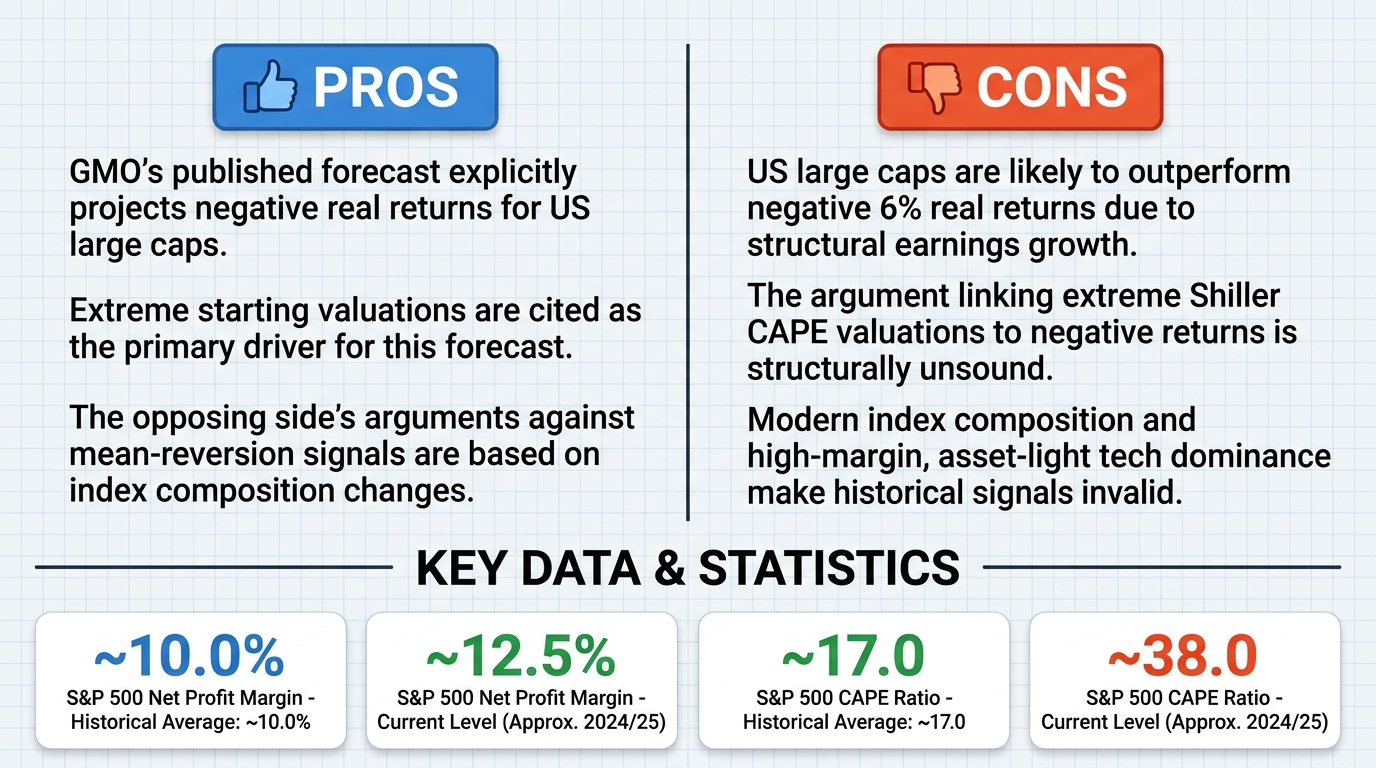
- ■GMO 's own published 7-year asset class forecast explicitly projects US large cap equities will deliver negative real returns , driven by extreme starting valuations . Their methodology anchors expected returns to current valuation multiples and mean-reverting profit margins . As of their most recent quarterly update, the Shiller CAPE ratio for the S&P 500 stood above 38, a level exceeded only during the 1999–2000 bubble peak. When the CAPE has been this elevated historically, subsequent 7-year real returns have been deeply negative. GMO's model translates this into a forecast of approximately –6% annualized real return.
- ■The opposing side argues that the Shiller CAPE 's historical mean-reversion signal is invalid because today's index is dominated by high-margin , asset-light technology firms that supposedly justify permanently higher valuation multiples . This argument is not supported by the evidence: the historical record already contains prolonged periods when technology and high-margin firms dominated the index, and CAPE mean reversion operated powerfully through those episodes regardless. The most direct counterexample is the 1999–2000 market peak, when the S&P 500 was also dominated by technology, media, and telecommunications companies that were widely described as asset-light, high-growth, and structurally different from the industrial firms of prior eras.
❌ Key ANTI arguments:
- ■US large cap stocks will likely outperform negative 6% real returns due to structural earnings growth and technological productivity . The affirmative's reliance on mean reversion of the Shiller CAPE ratio as a deterministic driver of future returns is a flawed application of historical correlation to a structurally different economic era. The assertion that high valuations must lead to negative returns ignores the fundamental shift in the composition of US large-cap indices. Modern index leaders are not the capital-intensive , cyclical industrial firms of the 20th century, but high-margin , asset-light technology companies with significant pricing power and scalable business models . These firms exhibit different capital intensity and growth dynamics.
- ■The affirmative's central argument—that extreme Shiller CAPE valuations inevitably lead to negative seven-year real returns —is structurally unsound because the instrument used to signal 'extreme' values is internally inconsistent and lacks the precision required to serve as a predictive tool. The affirmative asserts that the CAPE ratio 'stands above 38,' yet simultaneously characterizes the 1999–2000 period as a 'bubble peak' that was 'exceeded only' by current levels. This creates a fundamental contradiction in the measurement: if the peak of the 1999–2000 bubble is the benchmark for the current 'extreme,' the signal itself is unstable. The affirmative fails to provide a single, consistent value for the peak, oscillating between describing it in different ways.
💭 Conclusion: False. The winning side successfully undermined the predictive reliability of the Shiller CAPE -based forecast by showing that modern index composition differs structurally and that the CAPE signal is internally inconsistent. The negative side argued that high-margin , asset-light technology firms justify higher valuations, so mean reversion is not deterministic. It also pointed out a contradiction in the affirmative's use of the 1999–2000 peak as a benchmark while claiming current CAPE exceeds it. Therefore the assertion that US large caps will generate negative 6% real returns is not established. The confidence reflects the judge's 80% confidence in the false verdict.
🔬 DeepResearch Result: likely FALSE ❌ (80%)
Assertion: US large cap stocks will generate negative 6% real returns over the next seven years, according to GMO 's forecast.
Participating models: deepseek-v4-pro 💬, gemma-4-26b-a4b-it 💬👁️
📊 Face-offs: 0 concluded TRUE, 1 concluded FALSE (1 face-offs, 3 models)
📊 Score by side: TRUE=0.00, FALSE=0.80
🏅 Model score changes:
deepseek-v4-flash-0731 💬: +8
✅ PRO Arguments:
- ■GMO's own published 7-year asset class forecast explicitly projects US large cap equities will deliver negative real returns, driven by extreme starting valuations . Their methodology anchors expected returns to current valuation multiples and mean-reverting profit margins . As of their most recent quarterly update, the Shiller CAPE ratio for the S&P 500 stood above 38, a level exceeded only during the 1999–2000 bubble peak. When the CAPE has been this elevated historically, subsequent 7-year real returns have been deeply negative. GMO's model translates this into a forecast of approximately –6% annualized real return. deepseek-v4-pro 💬
- ■The opposing side argues that the Shiller CAPE's historical mean-reversion signal is invalid because today's index is dominated by high-margin , asset-light technology firms that supposedly justify permanently higher valuation multiples. This argument is not supported by the evidence: the historical record already contains prolonged periods when technology and high-margin firms dominated the index, and CAPE mean reversion operated powerfully through those episodes regardless. The most direct counterexample is the 1999–2000 market peak, when the S&P 500 was also dominated by technology, media, and telecommunications companies that were widely described as asset-light, high-growth, and structurally different from the industrial firms of prior eras. deepseek-v4-pro 💬
❌ ANTI Arguments:
- ■US large cap stocks will likely outperform negative 6% real returns due to structural earnings growth and technological productivity . The affirmative's reliance on mean reversion of the Shiller CAPE ratio as a deterministic driver of future returns is a flawed application of historical correlation to a structurally different economic era. The assertion that high valuations must lead to negative returns ignores the fundamental shift in the composition of US large-cap indices. Modern index leaders are not the capital-intensive , cyclical industrial firms of the 20th century, but high-margin, asset-light technology companies with significant pricing power and scalable business models . These firms exhibit different capital intensity and growth dynamics. gemma-4-26b-a4b-it 💬👁️
- ■The affirmative's central argument—that extreme Shiller CAPE valuations inevitably lead to negative seven-year real returns—is structurally unsound because the instrument used to signal 'extreme' values is internally inconsistent and lacks the precision required to serve as a predictive tool. The affirmative asserts that the CAPE ratio 'stands above 38,' yet simultaneously characterizes the 1999–2000 period as a 'bubble peak' that was 'exceeded only' by current levels. This creates a fundamental contradiction in the measurement: if the peak of the 1999–2000 bubble is the benchmark for the current 'extreme,' the signal itself is unstable. The affirmative fails to provide a single, consistent value for the peak, oscillating between describing it in different ways. gemma-4-26b-a4b-it 💬👁️
💭 Reasoning: False. The winning side successfully undermined the predictive reliability of the Shiller CAPE-based forecast by showing that modern index composition differs structurally and that the CAPE signal is internally inconsistent. The negative side argued that high-margin, asset-light technology firms justify higher valuations, so mean reversion is not deterministic. It also pointed out a contradiction in the affirmative's use of the 1999–2000 peak as a benchmark while claiming current CAPE exceeds it. Therefore the assertion that US large caps will generate negative 6% real returns is not established. The confidence reflects the judge's 80% confidence in the false verdict.
📋 PRO Facts:
• GMO's published 7-year asset class forecast projects US large cap equities will deliver negative real returns.
• GMO's model translates extreme valuations into a forecast of approximately –6% annualized real return.
• The Shiller CAPE ratio for the S&P 500 stood above 38 in GMO's most recent quarterly update.
• A CAPE level above 38 has been exceeded only during the 1999–2000 bubble peak.
• GMO's forecast is driven by extreme starting valuations and mean-reverting profit margins.
📋 ANTI Facts:
• Modern US large-cap indices are dominated by high-margin, asset-light technology companies with significant pricing power and scalable business models.
• These firms exhibit different capital intensity and growth dynamics than the capital-intensive, cyclical industrial firms of the 20th century.
• The historical record already contains prolonged periods when technology and high-margin firms dominated the index, such as the 1999–2000 peak when the information technology sector constituted over 34% of the S&P 500's market capitalization .
• Structural earnings growth and technological productivity may allow US large caps to outperform negative 6% real returns.
• Mean reversion of the Shiller CAPE ratio is a flawed application of historical correlation to a structurally different economic era.
| Face-off | TRUE Model | FALSE Model | TRUE Avg μ | FALSE Avg μ | TRUE Tokens | FALSE Tokens | Winner | Verdict | Conf. |
|---|---|---|---|---|---|---|---|---|---|
| #1 | deepseek-v4-pro 💬 | gemma-4-26b-a4b-it 💬👁️ | 0.540 | 0.177 | 6 | 2 | TRUE | FALSE | 80% |
The following technical terms, abbreviations, and domain-specific concepts are referenced throughout this debate transcript. Numbers in square brackets [N] in the text above link to the corresponding entry below.
[1] 7-year asset class forecast — A projection of expected returns for a category of investments over a seven-year horizon, such as GMO's forecast cited in the debate.
[2] annualized return — The average yearly return over a multi-year period, expressed as if the return were compounded annually.
[3] asset class — A category of investments with similar characteristics, such as US large-cap stocks.
[4] asset-light — Describing businesses that require relatively little fixed capital investment to generate revenue, often associated with technology firms.
[5] CAPE — Cyclically Adjusted Price-to-Earnings ratio — A stock market valuation measure using ten-year average inflation-adjusted earnings; the debate disputes whether its current high level predicts negative future returns.
[6] capital intensity — The amount of capital investment required to generate a unit of revenue; the debate contrasts capital-intensive and asset-light firms.
[7] capital-intensive — Requiring large investments in physical assets, as with traditional industrial firms.
[8] cyclical industrial firms — Industrial companies whose performance varies with the economic cycle, contrasted with modern technology firms in the debate.
[9] digital-era monopolies — Dominant technology companies of the digital era that the negative side argues may justify higher valuation multiples.
[10] dividends — Distributions of a company's earnings to shareholders, a component of stock returns.
[11] earnings growth — The increase in a company's profits over time, a component of stock returns.
[12] earnings quality — The degree to which reported earnings are sustainable and reflect underlying economic performance.
[13] GMO — Grantham, Mayo, Van Otterloo — An investment management firm whose 7-year asset class forecast of negative US large-cap real returns is cited in the debate.
[14] high-margin — Describing businesses that retain a large share of revenue as profit, often used for technology companies.
[15] historical correlation — A statistical relationship observed in past data; the debate disputes its use for predicting future returns.
[16] index — A constructed portfolio of securities representing a market segment, such as the S&P 500.
[17] information technology sector — The stock market segment comprising technology companies; the debate notes its historical weight in the S&P 500.
[18] large cap — large capitalization — Stocks of companies with a large market capitalization, typically representing major established companies.
[19] long-run average — The historical mean of a variable over an extended period; the debate compares the CAPE to its long-run average.
[20] market bubble — A period when asset prices rise far above their intrinsic value; the debate references the 1999–2000 peak.
[21] market capitalization — The total market value of a company's outstanding shares, used to weight index constituents.
[22] market regime — A persistent set of market conditions; the debate questions whether current high valuations are an anomaly.
[23] mean reversion — The theory that asset prices and valuation metrics tend to return to their long-run average over time; the debate disputes its applicability to current markets.
[24] mean-reverting — Tending to return to a long-run average, used in the debate to describe profit margins and valuation multiples.
[25] multiple contraction — A reduction in a stock's valuation multiple, such as its price-to-earnings ratio, which can lower returns.
[26] New Economy — A term used during the late-1990s to describe technology and internet-driven businesses believed to make traditional valuation metrics obsolete.
[27] pricing power — A company's ability to raise prices without significantly reducing demand, supporting profit margins.
[28] profit margins — The percentage of revenue that a company retains as profit; the debate discusses whether they revert to historical averages.
[29] real returns — Investment returns adjusted for inflation, reflecting actual purchasing power gained or lost.
[30] S&P 500 — Standard & Poor's 500 — A stock market index of 500 large US companies, used as a benchmark for US large-cap stocks.
[31] scalable business models — Business models that can grow revenue without proportional increases in costs, characteristic of technology firms.
[32] Shiller CAPE ratio — Shiller Cyclically Adjusted Price-to-Earnings ratio — A version of the CAPE valuation measure named after economist Robert Shiller; the debate disputes whether its high level predicts negative returns.
[33] starting valuations — The valuation level of an asset at the beginning of a forecast period, used to anchor expected returns.
[34] structural earnings growth — Earnings growth driven by long-term changes in the economy or business environment rather than cyclical factors.
[35] technological productivity — Productivity gains resulting from technological innovation, cited by the negative side as supporting earnings growth.
[36] valuation compression — A decline in valuation multiples, which reduces stock prices; the debate argues whether it will occur.
[37] valuation metrics — Quantitative measures used to assess whether an asset is cheap or expensive, such as price-to-earnings ratios.
[38] valuation multiples — Ratios used to value a company relative to a financial metric, such as price-to-earnings; the debate discusses them as anchors for expected returns.
The following financial data tables were referenced during the debate exchanges:
| Metric | Historical Average (Long-term) | Current Level (Approx. 2024/25) |
|---|---|---|
| S&P 500 CAPE Ratio | ~17.0 | ~38.0 |
| S&P 500 Net Profit Margin | ~10.0% | ~12.5% |
| Tech Sector Weight in S&P 500 | Lower | Significantly Higher |
Legend: Comparison of long-term historical averages against recent levels for US large-cap equity metrics. Values are approximate based on market data.
| Period/Metric | CAPE Ratio Reference | Status |
|---|---|---|
| Current (Approx. 2024/25) | > 38 | Asserted "Extreme" |
| 1999-2000 Peak | Unspecified/Variable | Asserted "Only Exceeded" |
Legend: Comparison of the affirmative's inconsistent CAPE ratio references. The lack of a precise, unified benchmark undermines the claim of historical uniqueness.
Face-off transcripts
- ■
Ownership & Trade Secrets. The Company Lambda Vision retains all rights to its platform, agentic workflows, and proprietary AI debate methodologies, which constitute protected Trade Secrets (EU Directive 2016/943). Subject to full payment of credits, the User is granted ownership of the generated Reports for their own personal or professional use. Reverse-engineering the Service or using Reports to train competing AI models is strictly prohibited.
- ■
No Professional Advice. Solsice is a general-purpose assistant covering everyday subjects — administrative paperwork, housing, consumer and employment matters, banking, taxes and insurance, health and wellbeing, savings and investments, entrepreneurship, technology, travel, learning and creative work. Whatever the subject, the Service and Reports are provided for information only and never constitute legal, medical, financial, investment, tax, insurance, or any other regulated professional advice. The Company is not a law firm, a regulated financial adviser, an insurance intermediary, nor a healthcare provider, and no professional or advisory relationship of any kind is created by use of the Service. Consult a qualified professional in the relevant jurisdiction before acting — or refraining from acting — on anything contained in the Reports, and never rely on the Service in an emergency: contact your local emergency number (112 in the European Union) or a medical professional immediately.
- ■
AI-Generated Content, Sources and Viewpoints. Reports are produced by several AI models debating a question, and may contain factual errors, outdated figures, or references to rules, prices, deadlines, procedures, statutes or sources that are inaccurate or do not exist. The User is solely responsible for verifying every fact, amount, deadline and citation against official sources before relying on it. Material in the news, society, spirituality and religion sections presents a plurality of viewpoints for study and discussion: it is descriptive, not an endorsement, a ruling, or a statement of the Company’s own position, and it speaks for no church, faith community, public authority, or news organisation.
- ■
Liability & Governing Law. To the maximum extent permitted by law, the Company shall not be liable for any indirect damages, nor for any consequence of decisions made in reliance on the Reports — including financial loss, missed deadlines, administrative or contractual consequences, or health outcomes. These Terms are governed by French law. Any disputes shall be subject to the exclusive jurisdiction of the Courts of Paris, France.